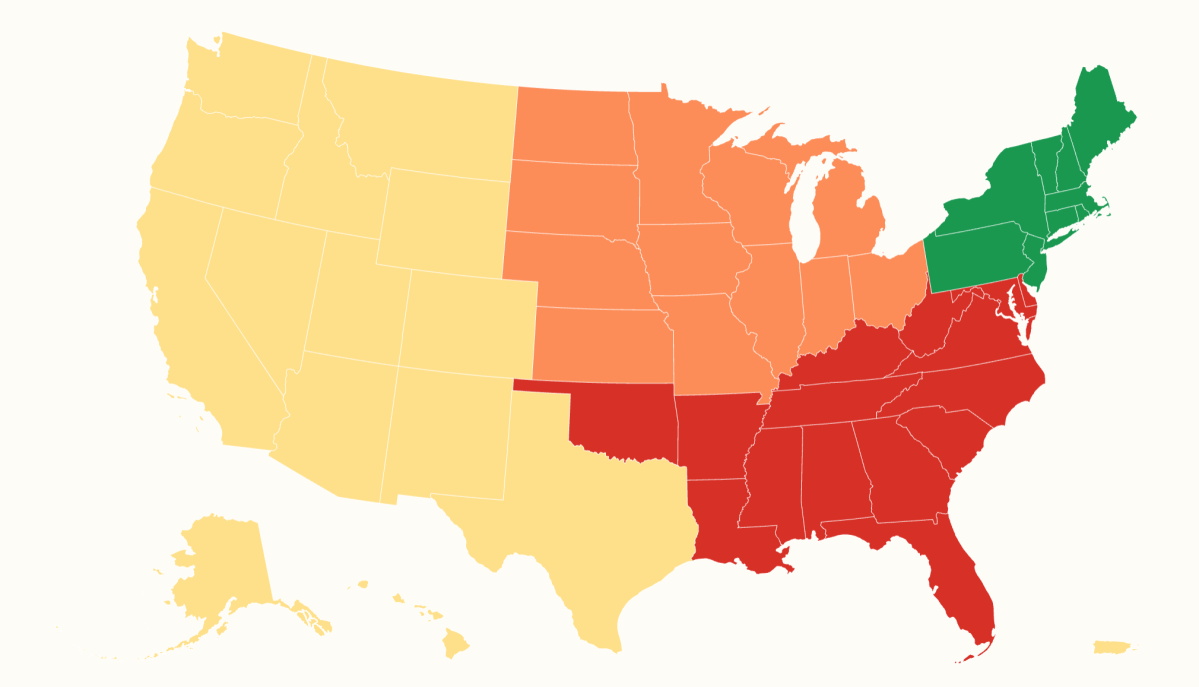
Map Reveals the Winners and Losers of July’s Housing Market
Summary
In July, sales of existing homes in the U.S. fell compared to June, partly because mortgage rates rose above 6.5 percent, making it harder for many people to afford buying a home. Home prices continued to rise in most regions, with some areas like the Northeast seeing increased sales despite higher prices.Key Facts
- Existing home sales dropped 1.7% in July compared to June, with 4.06 million homes sold.
- Mortgage rates averaged 6.69% in late July, increasing for five straight weeks.
- The median price for an existing home was $434,100 in July, marking 37 months of price increases.
- The Northeast was the only region where home sales rose in July, increasing by 2%, even though prices there grew by 5.2% from last year.
- The Midwest saw a 2% drop in sales from June but remains more affordable, with median home prices around $342,900.
- The South experienced a 3.1% sales decrease from June, with home prices slightly up by 0.9% year-over-year.
- In the West, sales stayed flat in July but were up 1.4% compared to a year ago, with median prices at $622,200.
- Expected improvements in housing affordability did not occur this year, keeping the market slow.
Read the Full Article
This is a fact-based summary from The Actual News. Click below to read the complete story directly from the original source.